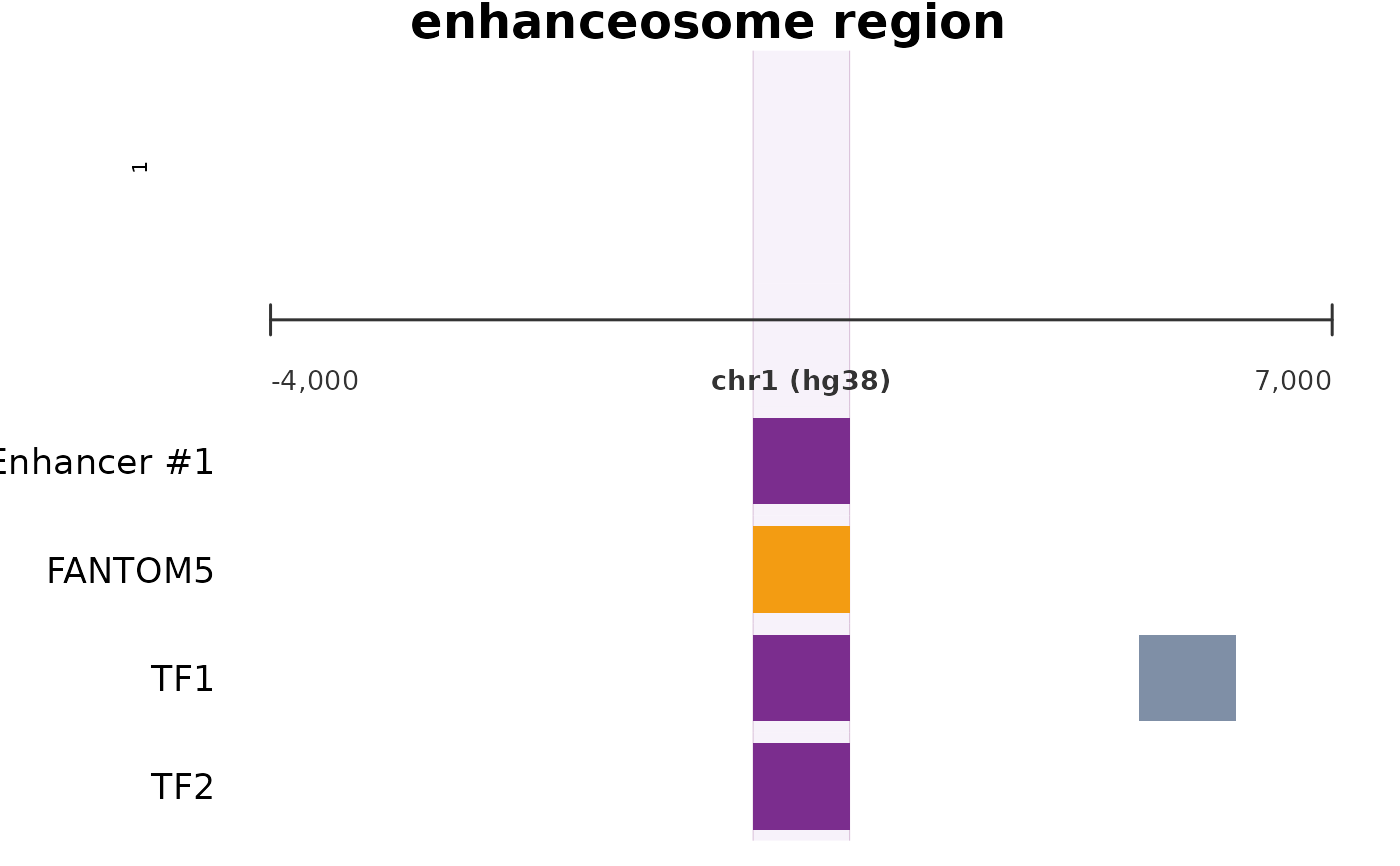
Renders a stacked multi-panel genome browser view using base R graphics. Includes gene model, BigWig signal tracks (ATAC, RNA, histone), enhancer index, chromatin state bars, FANTOM/UCNE annotations, TF binding peaks, and ncRNA annotations. A translucent violet highlight column marks the enhancer region of interest across all panels. Typically renders in 1-2 seconds.
Usage
plot_tracks(
  putative_enhanceosome,
  index,
  database,
  track_connection,
  keep_epitracks = TRUE,
  chromatin_states = NULL,
  gene_lookup = FALSE,
  show_bigwig = TRUE,
  show_chromatin = TRUE,
  show_annotations = TRUE,
  show_gene_model = TRUE,
  show_enhancer_highlight = TRUE,
  mirror = TRUE,
  signal_style = c("line", "polygon"),
  signal_layout = "auto",
  cex_cell_label = 1.4,
  cex_axis = 1.2,
  cex_coord = 1.3,
  cex_annotation = 1.1,
  cex_gene = 1.2,
  cex_title = 1.5,
  cex_signal_label = 1.2,
  quantile_cap = 0.98,
  scale_factor = 1.1,
  export = NULL,
  width = 10,
  height = 8
)

plot_tracks_fast(
  putative_enhanceosome,
  index,
  database,
  track_connection,
  keep_epitracks = TRUE,
  chromatin_states = NULL,
  gene_lookup = FALSE,
  show_bigwig = TRUE,
  show_chromatin = TRUE,
  show_annotations = TRUE,
  show_gene_model = TRUE,
  show_enhancer_highlight = TRUE,
  mirror = TRUE,
  signal_style = c("line", "polygon"),
  signal_layout = "auto",
  cex_cell_label = 1.4,
  cex_axis = 1.2,
  cex_coord = 1.3,
  cex_annotation = 1.1,
  cex_gene = 1.2,
  cex_title = 1.5,
  cex_signal_label = 1.2,
  quantile_cap = 0.98,
  scale_factor = 1.1,
  export = NULL,
  width = 10,
  height = 8
)
Arguments
- putative_enhanceosome
epiRomics class database containing putative enhanceosome calls
- index
numeric of row value from putative_enhanceosome to visualize
- database
epiRomics class database containing all data initially loaded
- track_connection
data frame containing bigwig track locations and their names
- keep_epitracks
logical indicating whether to show enhancer and chip tracks, default is TRUE
- chromatin_states
data.frame, optional output from
classify_chromatin_states. When provided, the enhancer track is colored by chromatin state and separate per-state annotation tracks are added.- gene_lookup
logical. When TRUE, omits the enhancer index bar and violet highlight column. Used internally by
plot_gene_tracksto display a gene locus without enhancer-specific visual elements. Default is FALSE.- show_bigwig
logical. Show BigWig signal tracks. Default TRUE.
- show_chromatin
logical. Show chromatin state color tracks. Default TRUE.
- show_annotations
logical. Show BED annotation tracks. Default TRUE.
- show_gene_model
logical. Show gene model panel. Default TRUE.
- show_enhancer_highlight
logical. Show enhancer index highlight. Default TRUE.
- mirror
logical. Use symmetric mirrored axes for paired ATAC/RNA signals. Default TRUE.
- signal_style
character. Signal rendering style:
"line"(default) draws vertical bars at each position (IGV/UCSC browser style),"polygon"draws filled area charts.- signal_layout
character. Signal rendering layout:
"auto"detects paired signals and mirrors,"stacked"renders one row per signal,"mirrored"always mirrors first two. Default"auto".- cex_cell_label
numeric. Font size for cell type labels (e.g. Alpha, Beta). Default 1.4.
- cex_axis
numeric. Font size for y-axis tick labels on signal tracks. Default 1.2.
- cex_coord
numeric. Font size for chromosome, start, stop, genome build text. Default 1.3.
- cex_annotation
numeric. Font size for BED annotation labels. Default 1.1.
- cex_gene
numeric. Font size for gene name labels in gene model. Default 1.2.
- cex_title
numeric. Font size for main plot title. Default 1.5.
- cex_signal_label
numeric. Font size for ATAC/RNA type indicator text. Default 1.2.
- quantile_cap
numeric. Percentile for capping extreme signal peaks (default 0.98). Peaks above this percentile are clipped to prevent axis compression.
- scale_factor
numeric. Y-axis headroom multiplier (default 1.1). Values above 1.0 add whitespace above the tallest signal peak.
- export
character or NULL. File path to auto-export the plot (e.g.
"plot.pdf","plot.eps","plot.png"). When NULL (default), plot is drawn on current device only.- width
numeric. Export width in inches. Default 10.
- height
numeric. Export height in inches. Default 8.
Value
Invisible NULL. The function produces
a base R multi-panel plot on the current graphics
device.
Examples
## plot_tracks requires a TxDb (Suggests) and a real BigWig file.
## This example confirms input validation fires correctly.
db <- make_example_database()
eso <- make_example_enhanceosome(db)
tc  <- data.frame(path = character(), name = character(),
  color = character(), type = character(),
  stringsAsFactors = FALSE)
if (requireNamespace("TxDb.Hsapiens.UCSC.hg38.knownGene", quietly = TRUE)) {
  tryCatch(
    plot_tracks(eso, 1L, db, tc),
    error = function(e) message(e$message)
  )
}
#>   2169 genes were dropped because they have exons located on both strands of
#>   the same reference sequence or on more than one reference sequence, so cannot
#>   be represented by a single genomic range.
#>   Use 'single.strand.genes.only=FALSE' to get all the genes in a GRangesList
#>   object, or use suppressMessages() to suppress this message.